Analyzing traffic I/O with Zabbix
Playing with the lab out of the box worked well for most tasks, however certain segments seemed to either function poorly or not at all. The details of most issues I've encountered are not relevant to this topic, but I'd like to cover what I believe to be the most notable; poor device input/output speeds. It was difficult to pinpoint, but my initial thought was either a hindrance of virtualization or limitation of the platform itself. To investigate, I downloaded and tested traffic flow with various tools (those being speedtest-cli, bmon and iperf3). These worked great individually, but were restricted by what could only be seen visually within the cli after command execution. Ultimately, I desired trackable trends over long periods, easily readable graphs and the option to review past stress tests.
After some brainstorming, I came to a solution I was familiar with. One of my companies most notable clients uses the Network Management Station (NMS), Zabbix. This tool provides vast features and extensive items for any network or server side monitoring need. To implement, a few configuration changes needed to be applied.
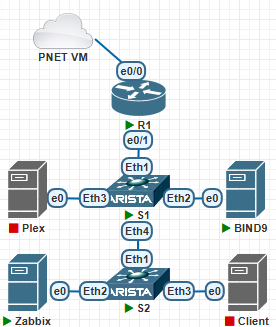
I started with the network devices in my topology (As pictured below). The Cisco router and both Arista switches share the same Simple Network Management Protocol (SNMP) configurations. This protocol reports all traffic requests on port 161 to the management station. The following changes were applied to each device:
snmp-server engineID local DC945798CB
snmp-server local-interface Vlan1
snmp-server community zabbix rw
snmp-server group quas v3 noauth
snmp-server user quas_eee quas v3
The server side config functions a bit differently though. The most simple integration with the platform comes with a propriety protocol named the "Zabbix Agent". It's simple in that you download the agent from the Zabbix repo, edit the zabbix_agentd.conf file parameters to match your NMS, and simply start the service.
Device configurations out of the way, the most important step is to implement the measurables for each host. SNMP allows this with Object IDentifiers (OIDs) - to put simply, a unique string of numbers separated by periods to represent a specific object. OIDs are then taken and input into an item for each host. Reading through vendor manuals and the types of entities available, I decided to graph device availability, interface incoming/outgoing traffic, inbound/outbound packets discarded and inbound/outbound packets with errors. Example structures for each is as follows (redacted for clarity):
Name - Interface Et0/0(): Bits Received
Key - net.if.in[ifHCInOctets.1]
Host Interface - 10.0.0.1:161
SNMP OID - 1.3.6.1.2.1.31.1.1.1.6.1
Update Interval - 3 minutes
Name - Interface Et0/0(): Outbound Packets Discarded
Key - net.if.out.discards[ifOutDiscards.1]
Host Interface - 10.0.0.1:161
SNMP OID - 1.3.6.1.2.1.2.2.1.19.1
Update Interval - 3 minutes
Name - Interface Et0/0(): Outbound Packets with Errors
Key - net.if.out.errors[ifOutErrors.1]
Host Interface - 10.0.0.1:161
SNMP OID - 1.3.6.1.2.1.2.2.1.20.1
Update Interval - 3 minutes
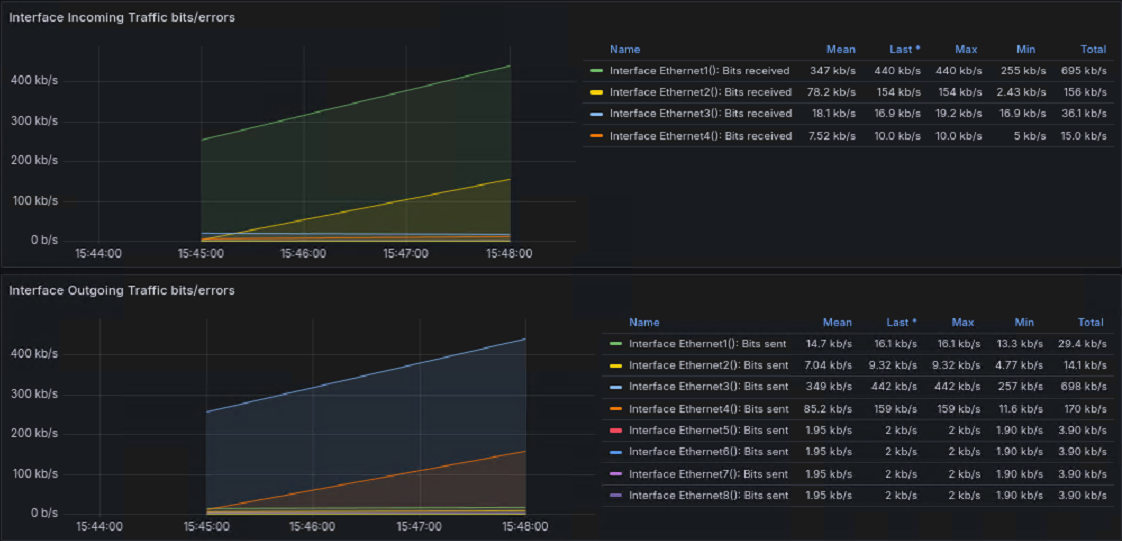
With visuals concrete, all that's left is to simulate a bandwidth stress test between Ubuntu clients. To initiate, I prompt my Zabbix server to listen for incoming connections with the "iperf3 -s" command and force my BIND9 DNS machine to prompt traffic in client mode (as pictured above). The command "iperf3 -c 10.0.0.70 -t 120 -b 100M" when broken down, initiates connection to the server at 10.0.0.70 for two minutes and specifies a bandwidth limit of 100 Megabits per second.
Results are as shown:
I still unfortunately feel stuck in answering the root problem, but feel more confident expanding the topology knowing the platforms limitations.
-Dajae W.